
Most business cases for a virtual fitting room are built on the returns line, and that is the one line the technology cannot support. Understanding why, before anything else, saves a project from being measured against a target it was never able to reach.
What follows is the structure of the decision rather than a set of numbers. Published figures for this category come from other catalogs with other customers, and the range between them is wide enough to justify any conclusion someone already holds — which makes borrowing them worse than useless.
What the term covers
A virtual fitting room is a shopper-facing experience: a customer sees a garment presented on a body, sometimes their own, on a product page or in an app. It sits at the point of purchase and it addresses what the product looks like.
Two adjacent things get confused with it. Brand-side try-on imagery produces assets for listings and campaigns with no customer involvement. Size recommendation uses measurements, purchase history or scan data to suggest a size, and shares no mechanism with either.
The three have different costs, different owners, and different effects. A business case that mixes them will not survive its first review.
The mixing usually happens in the approval conversation rather than in the document. Someone describes a fitting room, someone else recalls a statistic about size recommendation, and the project acquires an expectation it was never designed to meet. Naming which of the three is being funded, in the first line, is the cheapest protection available.
What the technology actually requires
The visible experience is rarely the expensive part. Three requirements sit behind it and all three recur.
Assets, for every product the experience covers, produced to a consistent standard. Coverage is produced as queued batches rather than one product at a time, which is why the cost driver is the number of products in the covered category and not the number of sittings it takes to generate them. Coverage, meaning a defined and communicated share of the catalog rather than whatever happened to be ready. And currency, because a range turns over and an experience showing last season's coverage degrades without anyone noticing.
The third is the one most often unfunded. Projects of this kind are approved as a build and maintained out of nobody's budget, which produces excellent coverage at launch and patchy coverage within two seasons.
That decay is also the hardest thing to reverse, because by the time anyone notices, the feature has already taught shoppers that it appears unpredictably. Rebuilding coverage restores the assets and not the expectation, which takes considerably longer.
The cost side, itemized
| Cost | Recurs? | Usually owned by |
|---|---|---|
| Software or platform fee | Yes | The requesting team |
| Asset production for covered products | Yes, per season | Studio or imaging |
| Asset review before publication | Yes, scales with volume | Someone with product knowledge |
| Integration and page changes | Once, then per redesign | Engineering |
| Currency maintenance as the range turns | Yes | Frequently unassigned |
| Disclosure and rights review | Periodic | Compliance, per market and platform |
Fill this with your own figures. The point of the table is the recurrence column: four of the six repeat every season, which means a one-off business case will understate the cost by a wide margin in year two.
The benefit side: which lines are legitimate
Two are defensible and one is not.
Conversion on visual-uncertainty categories is legitimate, where the shopper's hesitation was about how a product looks rather than whether it fits. This effect is real and it is concentrated: it appears in categories that are hard to picture and easy to size, and is close to absent elsewhere.
Content saving is the second, and it is often larger than expected. Assets produced for the fitting room frequently serve listings, social and wholesale material as well, and a business case that credits them only to the fitting room is undercounting.
This line is undercounted for a structural reason: the saving lands in someone else's budget. The imaging or marketing team spends less, the fitting room project gets no credit, and the case looks weaker than the reality. Counting cross-use explicitly requires asking another team what they would otherwise have produced, which is a short conversation and frequently the one that decides the outcome.
Returns reduction is the line to leave out. The output is a visual asset. It does not predict fit, determine sizing, model how a fabric behaves in motion, or forecast returns. Apparel returns are driven largely by fit, which no image addresses, and including that line invites a comparison the project will lose.
Leaving it out is harder than it sounds, because returns is the line executives ask about first and the one with the largest number attached. The productive response is to say which intervention does address returns — sizing guidance, better measurement data, reviews from comparable bodies — and to note that it is a separate project with a separate owner. That answer is more credible than an estimate and it protects the project being discussed.
Coverage decides almost everything
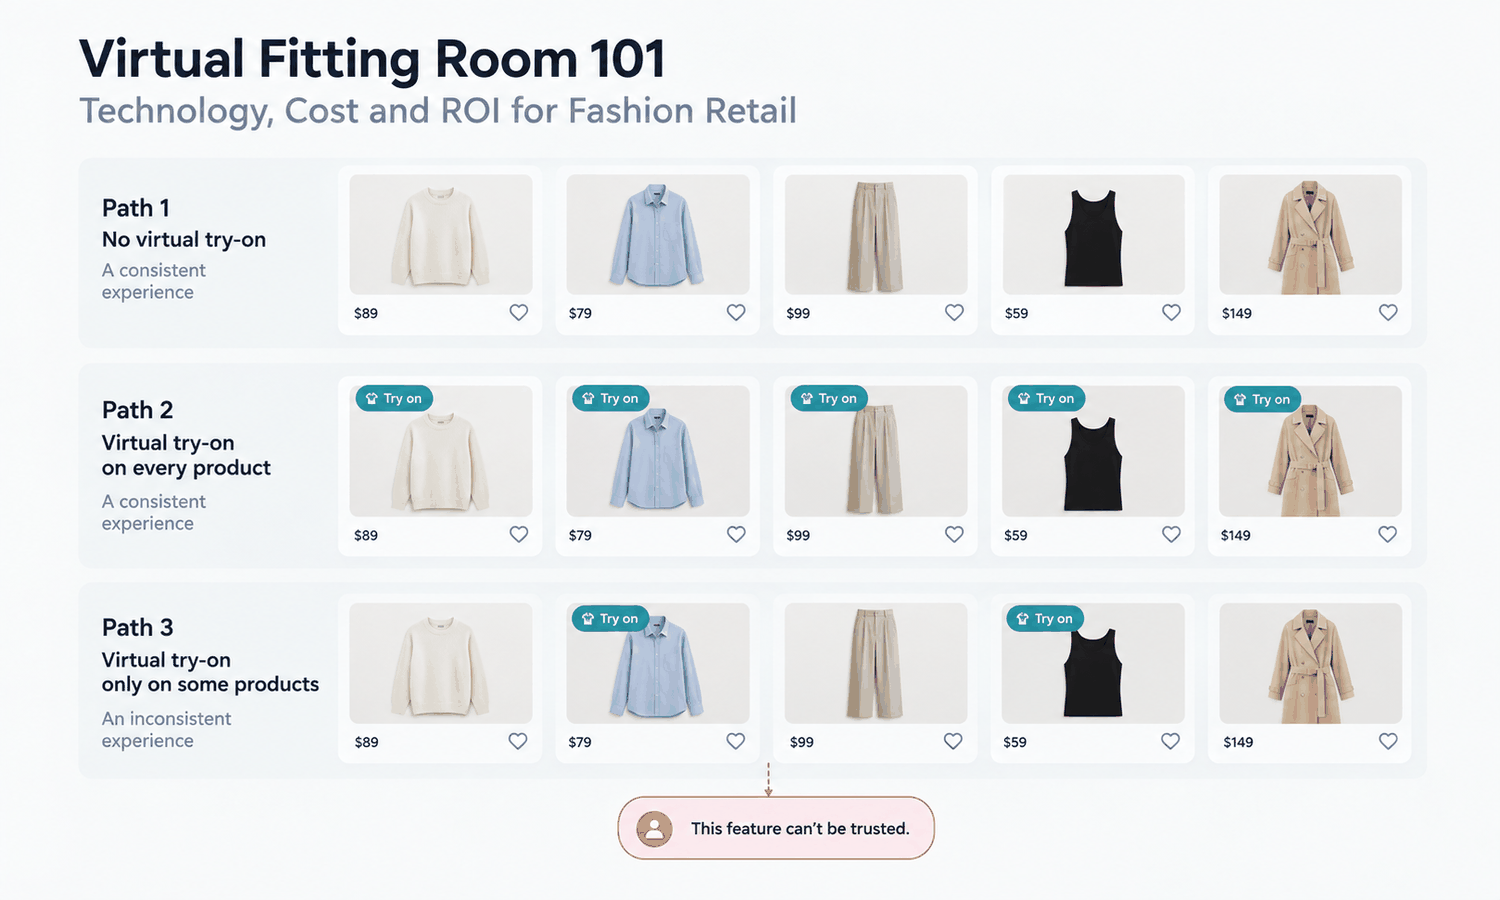
Partial coverage can perform worse than no coverage, which is the least intuitive part of this.
A shopper who finds the feature on one product and not the next learns that it is unreliable and stops looking for it. The value of the feature depends on being expected, and expectation is destroyed by inconsistency more quickly than it is built by quality.
That argues for full coverage of a defined category rather than scattered coverage across a range. Choose the categories where visual uncertainty dominates, cover them completely, and say so on the site. A clearly bounded feature is trusted; a randomly bounded one is not.
Coverage also sets the cost, since asset production scales with the number of products covered rather than with usage. The two decisions are the same decision, and treating them separately is how a project ends up with a coverage ambition that its asset budget cannot sustain past the first season.
Building the model with your own numbers
Take one category, not the catalog. Count the products, estimate the asset cost per product including review, and multiply — that is the recurring cost side for that category.
For the benefit side, measure rather than assume. Deploy on that category, hold a comparable category as a control, and compare conversion over a full purchase cycle including returns for the same cohort. Read the two categories separately rather than blending them.
Add the content saving by counting how many of the produced assets were used somewhere other than the fitting room. That number is usually available from whoever manages the site and is frequently the line that makes the case.
Run the model annually rather than once. The cost side is recurring and the benefit side moves with the range, so a case approved on last year's mix will drift, and the annual re-run is also the moment to check whether coverage has quietly decayed.
The model that results is specific to your catalog, which is the only kind that predicts anything. The underlying assets come from product photography you already hold — see AI Virtual Try-On, and Scale E-commerce for how coverage is maintained across a catalog.
What cannot go in the model
Beyond returns, three things resist inclusion and should be named rather than estimated.
Brand perception effects are real and not measurable at the resolution a business case needs. Note them as a qualitative consideration rather than assigning a number nobody can defend.
Competitive parity is similar. Deploying because others have is a legitimate reason and a poor line item, since the counterfactual cannot be observed. State it as a strategic decision made deliberately rather than dressing it as an economic one, which is both more honest and easier to defend when the numbers are questioned.
Color accuracy is outside the model entirely. Screen color is not a physical reference, so any benefit assumed from customers seeing true color is not available regardless of how the feature performs on other measures.
Questions retail teams ask
Can we justify this on returns? No. Returns in apparel are driven largely by fit, and the output is a visual asset that does not predict fit or sizing. Building the case on returns sets a target the project cannot meet.
What is the strongest benefit line? Conversion in categories where the hesitation is visual, plus the content saving from assets reused elsewhere. The second is frequently undercounted because it appears in someone else's budget.
Should we launch across the whole catalog? Rarely. Full coverage of a defined category outperforms scattered coverage, because an inconsistent feature teaches shoppers not to rely on it.
Why not use published ROI figures? They come from other catalogs and other customers, and the published range is wide enough to support any position. A figure quoted internally also becomes a target you will be measured against.
What is the most commonly missed cost? Currency maintenance as the range turns over. It recurs every season and is frequently assigned to nobody, which is why coverage decays quietly after launch.
How long should the test run? A full purchase cycle including the returns window for the same cohort, read by category rather than in aggregate.
What the business case should say
That the cost is recurring rather than one-off, that the benefit is concentrated in specific categories rather than spread across the catalog, and that returns are not in scope. Cover one category completely, run it against a control, count the assets that got reused elsewhere, and read the result by category. A case built that way is smaller than the ones people usually write, and it survives its second year — which the returns-based version does not.
Model one category before modeling the catalog.
**Pick the category where shoppers hesitate on appearance rather than on size, count the products, cost the assets including review, and run it against a comparable category left untouched. Measure conversion and returns on the same cohort, and count how many of the assets served other channels. That single exercise produces a defensible number, which no published figure can. → **AI Virtual Try-On