
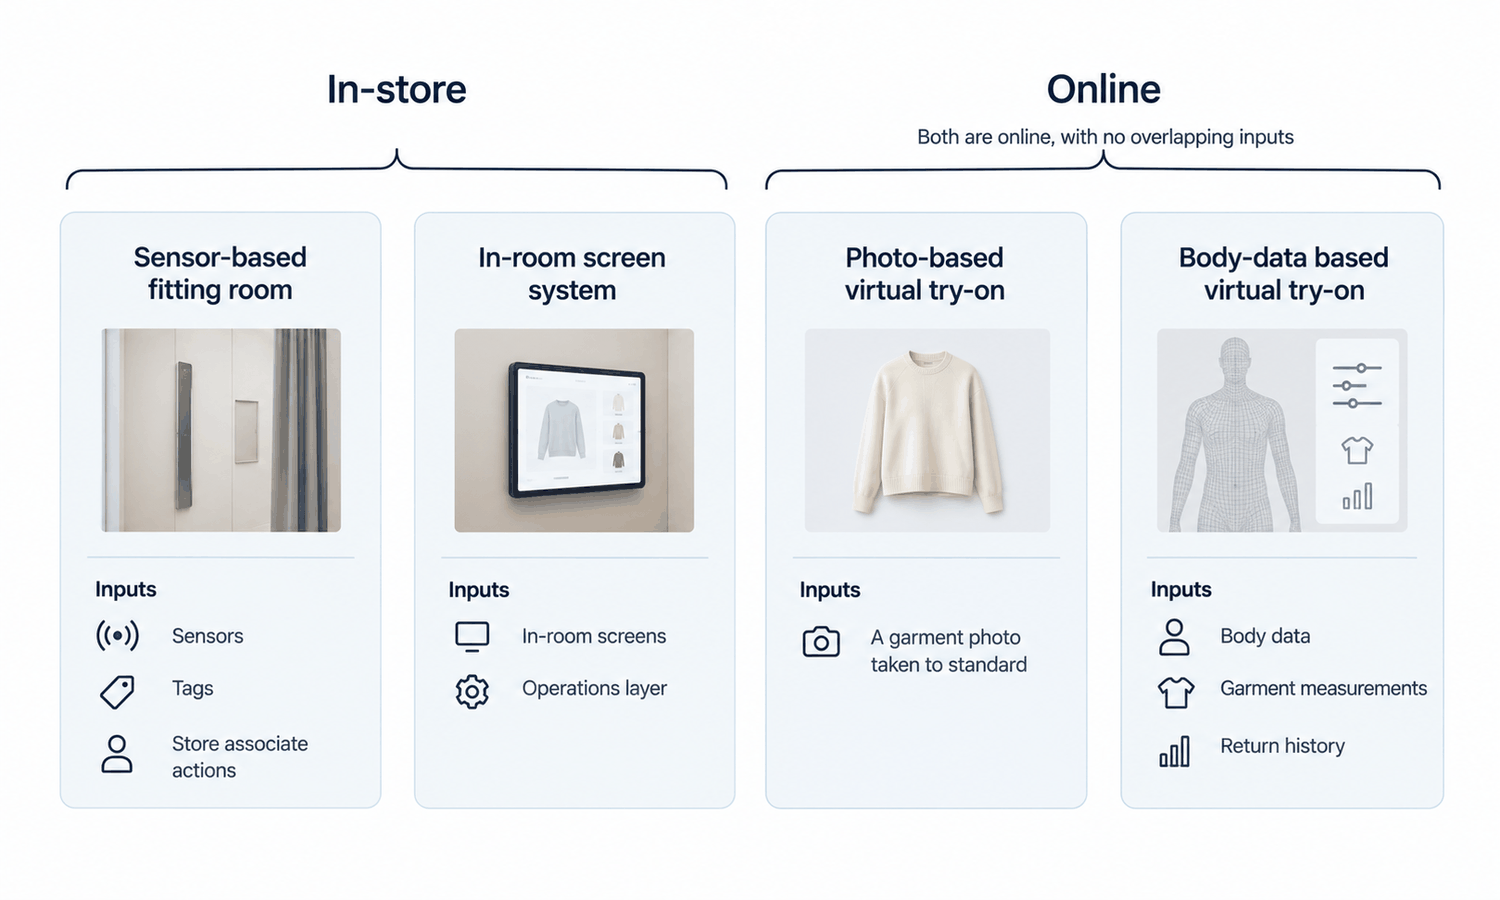
Fitting room software names at least four different systems. They solve different problems, for different people, using different inputs, and the only thing they share is the phrase.
That is why buyers end up with the wrong one. Somebody asks for a fitting room solution, everyone in the room pictures something, and the pictures do not match. Two of the four run in a physical store and two run online, and the two online ones are the pair most often confused with each other despite having almost nothing in common.
Sorting them takes a few minutes and prevents a procurement conversation that runs for a quarter.
Four systems, one phrase
| The system | What it runs on | The question it answers |
|---|---|---|
| In-store fitting room operations | Sensors, tags and staff actions on a shop floor | Which rooms are occupied, what went in, who needs a size brought to them |
| In-store assisted selling | A screen in the room, sitting on top of the operations layer | What else might this shopper want, and how do they ask for it |
| Online visualization | A photograph of a real garment, captured to a consistent standard | What does this look like, and how does it sit with what I own |
| Online size recommendation | Body data, garment measurements, and the retailer's own returns history | What size should I order. It renders nothing |
The rows are not variants of one product. Each has its own inputs, its own users, and its own definition of working, and a vendor in one row usually does not operate in the others.
The pair worth separating carefully is the last two, because they are both online, both described as virtual fitting rooms, and answer completely different questions.
In-store systems: an operations problem wearing a retail name
The first two rows belong to store operations rather than to imagery, and they are worth understanding mainly so they can be set aside.
Room allocation, queue management, and item tracking are logistics: how many rooms are occupied, what went in, what came out, whether somebody needs a different size brought to them. The inputs are sensors, tags, and staff actions, and success is measured in floor efficiency and staff time.
Assisted selling in the room — a screen that shows related items or lets a shopper request a size — sits on top of that and is measured in what happens next. Both are physical retail systems. Neither has anything to do with producing imagery, and a project that mixes them with an imagery workflow has combined two unrelated procurements.
The online visual system: what it shows and what it needs
The third row is a visualization system. It shows how a garment reads on a body, and its input is a photograph of a real garment plus a way of presenting it.
That input dependency is the part most often skipped in planning. Every visualization needs an asset, and the asset comes from photographing the garment to a consistent standard. Where that standard does not exist, the system shows an inconsistent range accurately, which is a worse outcome than not showing it.
The check that follows is unavoidable. Logos, printed text, care labels, and small hardware get compared against the source image on every single on-model output, without exception. Reconstructed detail lands almost right — a letterform slightly off, a stitch count wrong, a zipper pull the wrong shape — and a visualization system raises how closely a shopper looks, which raises the cost of every inaccuracy already present. In Lightchain AI (apparel AI) the uploaded source stays beside every AI Virtual Try-On output derived from it, which is what makes that comparison fast enough to hold at catalog volume.
What this system produces is appearance: proportion, styling, colorway direction, how a piece sits with other pieces. That is genuinely useful and it is a bounded thing.
Size recommendation is not a visual system
The fourth row looks adjacent and is a different kind of software entirely.
A size recommendation system takes body data — measurements a shopper enters, or inferred from what they have bought and kept — and compares it against garment measurements and, usually, the retailer's own history of what came back. Its output is a size, or a probability across sizes. It does not render anything, and adding a picture to it would not improve it.
The inputs tell you why. Nothing in that list is visual. The system works on the measurement chart, the grade, and the returns record, which are the same three things a fit answer has always come from. A visualization system holds none of them.
There is a practical consequence in how the two rows are supplied. Visualization needs the garment photographed to a standard; recommendation needs the garment measured to a standard. Most brands have one of those in reasonable shape and the other in poor shape, and which one is weak decides which of the two rows is available to them without a project attached. A brand with good measurements and inconsistent photography can buy recommendation and cannot yet buy visualization, and the reverse is equally common.
This is the distinction that makes the whole category legible. If the question is what does it look like, that is the third row and imagery answers it. If the question is what size should I order, that is the fourth row and measurements answer it. Asking either system the other question produces something plausible and unsupported.
What a visual system does not supply
Being precise here is what stops the two online rows collapsing back into one.
The output of a visualization workflow is a visual asset. It does not predict fit, determine sizing, model how a fabric behaves in motion, or forecast returns. Those come from measurements, a graded pattern, a physical sample, and your own data. That is a property of what a visual asset is rather than a limitation of any particular result, and no improvement in rendering moves it.
Size recommendation systems make claims of a different kind, which come with their own validation requirements: a recommendation is only as good as the garment measurements behind it and the body data it was given, and it is assessed against what customers kept rather than against how anything looked. Evaluating any particular one is outside what this article can do, and it should be judged on its own terms rather than by analogy with imagery.
Color sits with the visual row and has a hard edge. Screen color is not a physical reference, exact code matching is not something to promise, and the gap between a monitor and a roll of cloth stays open regardless of display quality. Colorways get settled by strike-offs against an agreed standard, so a colorway shown in a visualization is a representation rather than a commitment.
Footwear is not covered by this class of visualization workflow, and that is structural: a shoe is a rigid object built on a last, with no flat-lay equivalent to serve as the input the method depends on.
Working out which one you need
The question that resolves this is what problem is actually being reported, rather than which system sounds most complete.
-
If store staff are spending time fetching sizes and rooms sit occupied without being used, that is the operations row and it is a store systems procurement
-
If shoppers in a store abandon in the room, that is assisted selling, and it sits on top of the operations layer rather than replacing it
-
If online shoppers cannot tell what a piece looks like or how it would sit with what they own, that is the visualization row, and its real prerequisite is a capture standard
-
If online shoppers are ordering the wrong size, that is the size recommendation row, and no amount of imagery reaches it
-
If two of these are true at once, they are two projects with two owners, and treating them as one is how a schedule acquires a dependency nobody planned
The last point is the common failure. Across a catalog at scale the visualization row is an asset-production problem before it is a software one, and whether the work runs through Lightchain AI or a camera, the assets have to exist and be accurate before any surface can present them.
Frequently asked questions
Is a virtual fitting room the same as a size recommender?
No, and this is the most expensive confusion in the category. One shows appearance from a photograph of a garment; the other computes a size from measurements and history. They share a name, no inputs, and no failure modes.
Can one system do both?
Some products bundle them, and bundling is a packaging decision rather than a technical relationship. Evaluate each half against its own criteria, since a strong visualization half tells you nothing about the recommendation half or the reverse. Ask which half the vendor actually built.
Where does an in-store smart mirror fit?
In the assisted selling row, sitting on top of store operations. It is a physical retail deployment with hardware, installation and maintenance, and it is a different procurement from anything online. Judging it against online metrics produces a comparison neither side deserves.
What does the visualization row need before it can work?
A capture standard: consistent position, distance, background and light, held across the range. Without it the system presents an inconsistent range faithfully. That prerequisite is a photography project rather than a software one and it is usually the thing that has not been scheduled.
Our shoppers order two sizes and return one. Which row is that?
The size recommendation row, with a sizing and measurement question underneath it. Imagery does not reach this behavior, and treating it as a visualization problem spends a budget on the wrong half. Start with whether your published measurements match what ships.
How do we avoid buying the wrong one?
Write down the problem as a sentence about who is affected and where, before looking at any product. Store staff, in-store shoppers, and online shoppers asking two different questions is four sentences, and each one points at a different row. Products described as fitting room software will match several of them.
In closing
Four systems share one phrase: two that run a physical fitting room and two that run online. The online pair is where the confusion costs most, because a visualization system answers what does this look like and a size recommendation system answers what should I order, and those questions need entirely different inputs. Decide which sentence describes your problem before evaluating anything. If the answer is visualization, the prerequisite is a capture standard rather than software, and that is usually the part nobody scheduled.
Start here
Write the problem as one sentence naming who is affected and where it happens. Then check which of the four rows that sentence points at. Most teams discover the sentence they would have written is not the one the request came in as, and that gap is the whole procurement decision. It costs ten minutes and it is the cheapest step in the process, and it is the only one that gets harder once a shortlist exists.
**Start with catalog-scale asset work → **https://www.lightchainai.com/global/solutions/scaleECommerce