
Search the question and you get two incompatible answers. Vendor pages carry confident percentages. The peer-reviewed literature is considerably more cautious, and the caution is the finding.
A systematic literature review of virtual fitting room technology set out to organize this field precisely because the existing studies disagree with one another, and it names those conflicting findings as the reason the review was needed. A systematic review published in Applied Sciences reaches a similar position from a different direction, noting that the studies it synthesized vary considerably in design, sample, and method, which limits how definitively their results can be combined or generalized.
That is what the data shows: not that virtual changing rooms fail to reduce returns, and not that they succeed, but that the published evidence does not currently settle it. The useful work is in understanding why, because the reason tells you what to do.
What the published reviews actually report
Both reviews are secondary sources, which is what makes them worth reading first. A single study can be built around a favorable case; a review has to account for the ones that were not.
The first review is explicit that the field's findings conflict, and it frames its own contribution as sorting a literature that had not resolved the question. The second is candid about the limits of what a synthesis can conclude when the underlying studies differ that much in how they were run, and it flags variability in quality alongside variability in design.
Neither says the effect is absent. Both say the evidence base is not in a state where a general claim can be drawn from it, which is a different and more useful statement. Absence of established evidence is not evidence of absence, and it is also not permission to assert the opposite.
Why the confident numbers and the literature disagree
| Kind of evidence | What it can support | What it cannot |
|---|---|---|
| A single retailer comparing before and after a launch | That something changed at that retailer in that period | Which of the several things that changed was responsible |
| Vendor case material citing a named brand | That the brand and the vendor agreed the figure could be published | A general effect, since the cases that went badly are not published |
| A controlled study measuring intention or confidence | A real effect on the variable it measured | A conclusion about returns, which is a different variable observed months later |
| A split test on your own traffic, by reason code | A local effect for those styles, in that season, at your accuracy standard | A result that transfers to a different catalog or a different image quality |
| A systematic review of the published work | An honest account of how settled the question is | A number, when the underlying studies disagree with one another |
Read down the second column and the disagreement stops being mysterious. The confident figures generally come from single-retailer before-and-after comparisons or from vendor case material, and those designs cannot separate the feature from everything else that changed in the same period: the assortment, the price architecture, the traffic mix, the size range, a photography refresh that usually accompanies a launch.
The academic work, meanwhile, frequently measures something adjacent to returns rather than returns themselves. Purchase intention, confidence, and satisfaction are easier to observe in a controlled setting than an actual return six weeks later, so a study can find a real effect on a real variable that is not the variable the business question is about.
The mechanism explains more than the average would
A return happens when a garment fails to meet the expectation somebody had when they bought it. That expectation is assembled from the size selected, the size guide, the description, the price, the reviews, and the images.
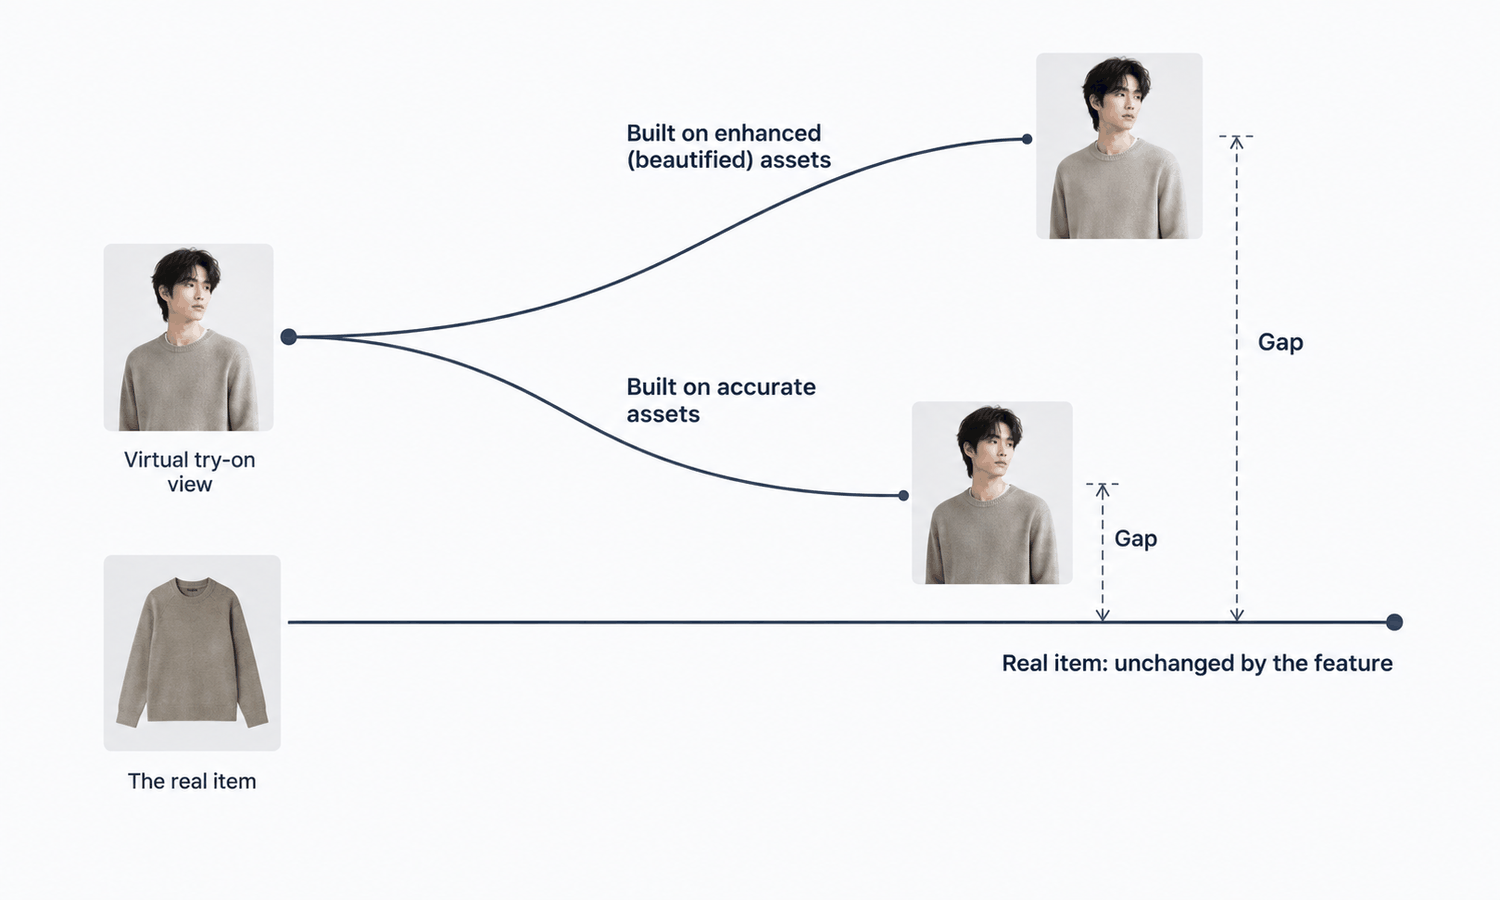
A virtual changing room acts on one component of one side of that equation. It cannot change how the garment is cut, graded, or sewn. What it changes is how accurately, or inaccurately, the shopper's expectation is formed.
That is why the direction of the effect is not fixed. A view built on imagery that accurately represents the garment narrows the gap. A view built on imagery that flatters the garment widens it, because the shopper now has a more vivid and more wrong expectation than they had from a thumbnail. The same feature, implemented two ways, moves the number in opposite directions, which is one plausible reason the literature finds what it finds.
Anything that raises how closely a shopper examines a garment raises the cost of every inaccuracy already present in your catalog imagery. That is a design consequence rather than a caveat.
What no image settles
The output is a visual asset. It does not predict fit, determine sizing, model how a fabric behaves in motion, or forecast returns. Those come from measurements, a graded pattern, a physical sample, and your own data. That is a property of what the asset is rather than a limitation of any particular result, and no improvement in image quality moves it.
Three consequences follow directly. A size recommendation cannot be derived from imagery, so guidance on a product page has to trace back to measurements and to your own history in that category. A size guide assembled from pictures is a sizing claim with nothing behind it. And no asset or feature of this kind can be presented as the reason a return rate moved, since a return rate sits at the end of a chain running through sizing, price, assortment, and traffic.
Color deserves its own line, because a shade dispute is a return in progress. Screen color is not a physical reference, exact code matching is not something to promise, and the gap between a monitor and a roll of cloth stays open regardless of display quality. Colorways get settled by strike-offs against an agreed standard, so a colorway view shows which options exist rather than the exact shade that will arrive.
What you can establish about your own returns
The general question is unsettled. The local one is answerable, and it is the one that pays.
-
Separate your return reasons rather than watching a single rate. Too small, too large, not as pictured, and changed my mind move for different causes, and only one of them points at imagery
-
Split by traffic rather than by time, so the comparison is not contaminated by season, promotion, or assortment changes that arrived in the same window
-
Measure at style level rather than site level, since a site aggregate mixes categories that behave differently and hides the effect in both directions
-
Write the method before the test, including what result would count as a null, so the outcome cannot be reinterpreted afterwards
-
Test where visual proportion carries most of the order decision, since that is where a mechanism operating on expectation has the most room to act
If you cannot run that, the honest position is to say the numbers moved and the cause is not established. That sentence is more defensible than any inference and it protects you in the season the numbers move the other way. Not as pictured is worth watching regardless, because it is the only reason code that points directly at imagery and it can be read without any of the machinery above.
What to do while the question stays open
Adopt or decline for reasons that do not depend on the unsettled claim, and there are several available.
A try-on view is a better way to communicate proportion and styling than a flat product shot, and that is worth something on its own terms. Generated imagery lets a range be shown in more contexts without a second shoot. Neither of those requires a returns argument, and building the business case on the returns number means the whole case collapses the first time somebody asks for the source.
What the accuracy discipline requires does not change either way. Every generated image is a derivation from a source photograph, so a consistent capture standard decides what the feature can be. The same applies to how colorway options are presented, which is a shortlist rather than a shade. Logos, printed text, care labels, and small hardware get compared against the source image on every single output, without exception, since reconstructed detail lands almost right and a shopper examining a garment in a try-on view is the most attentive reviewer in the chain. In Lightchain AI (apparel AI) the uploaded source stays beside the on-model outputs derived from it in AI Virtual Try-On, which is what makes that comparison quick enough to actually happen on every image.
Whether the imagery runs through Lightchain AI or a camera, the mechanism is the same and so is the obligation. The feature can only help by making expectations more accurate, which means the accuracy is the intervention and the feature is the delivery.
Frequently asked questions
So is the answer no?
The answer is that it is not established, which is different from no. The reviews report conflicting findings rather than null findings, and the effect may well be real in some implementations and absent in others. Treat a general claim as unsupported and your own measurement as the thing that could settle it locally.
A vendor showed us a figure from a named retailer. Is that worthless?
Not worthless, and not evidence of a general effect either. Ask what else changed at that retailer in the same period, whether the comparison was split by traffic or by time, and whether the figure is a return rate or a specific reason code. Those three questions usually resolve how much weight the number can carry.
Our returns fell after launch. Can we say the feature did it?
Say what changed and what moved in separate sentences, without a connecting word implying causation, unless you ran a split test. Check whether the not as pictured code specifically fell while the others held, since that pattern is the closest thing to evidence available without a holdout. Most launches coincide with a photography refresh, which is a second candidate explanation.
Would better imagery settle the question?
It would change your local result and not the state of the literature. Better imagery narrows the expectation gap, which is the mechanism by which any effect would occur, so it is the right thing to invest in regardless of the evidence base. It does not make a general claim available.
What about categories where fit is not the issue?
Where the order decision turns on proportion and styling rather than on fit, a view acting on expectation has more room to work and less competition from sizing. Accessories and outerwear often sit there. Categories dominated by fit uncertainty depend more on the measurement chart than on any image.
How should we present this internally?
Present the mechanism rather than a number: the feature acts on expectation, expectation is one side of the return, and accuracy determines the direction. That framing survives scrutiny and does not require a figure you would have to defend. It also makes clear why the imagery discipline is the investment rather than the feature itself.
In closing
The published reviews do not support a general claim in either direction, and they say so explicitly enough that anybody quoting a confident percentage should be asked where it came from. What is stable is the mechanism. A return is the gap between expectation and garment, a virtual changing room acts only on expectation, and whether it narrows or widens the gap depends on whether the imagery behind it is accurate. That makes accuracy the intervention. The feature is how it reaches the shopper, and a feature built on flattering imagery will move the number in the direction nobody wanted.
Start here
Pull your return reasons for one season and separate not as pictured from too small and too large. Most teams have never looked at that split and find the imagery-attributable share smaller than assumed and the sizing share larger. That one view tells you whether a changing-room feature is even operating on your largest problem, and it costs an afternoon rather than a pilot. Whatever it shows, write the method down before you look, so the result is a finding rather than a reading.
**Start with catalog-scale asset work → **https://www.lightchainai.com/global/solutions/scaleECommerce