
There are two different data questions hiding behind ai try-on and return rates, and mixing them produces an argument nobody can settle.
The first is whether this class of technology reduces returns in general. A published systematic review of the field reports that the underlying studies vary enough in design, sample, and method to limit what can be concluded by combining them, and the wider literature disagrees with itself, so the general question is currently unsettled and no confident percentage should be quoted as though it were not.
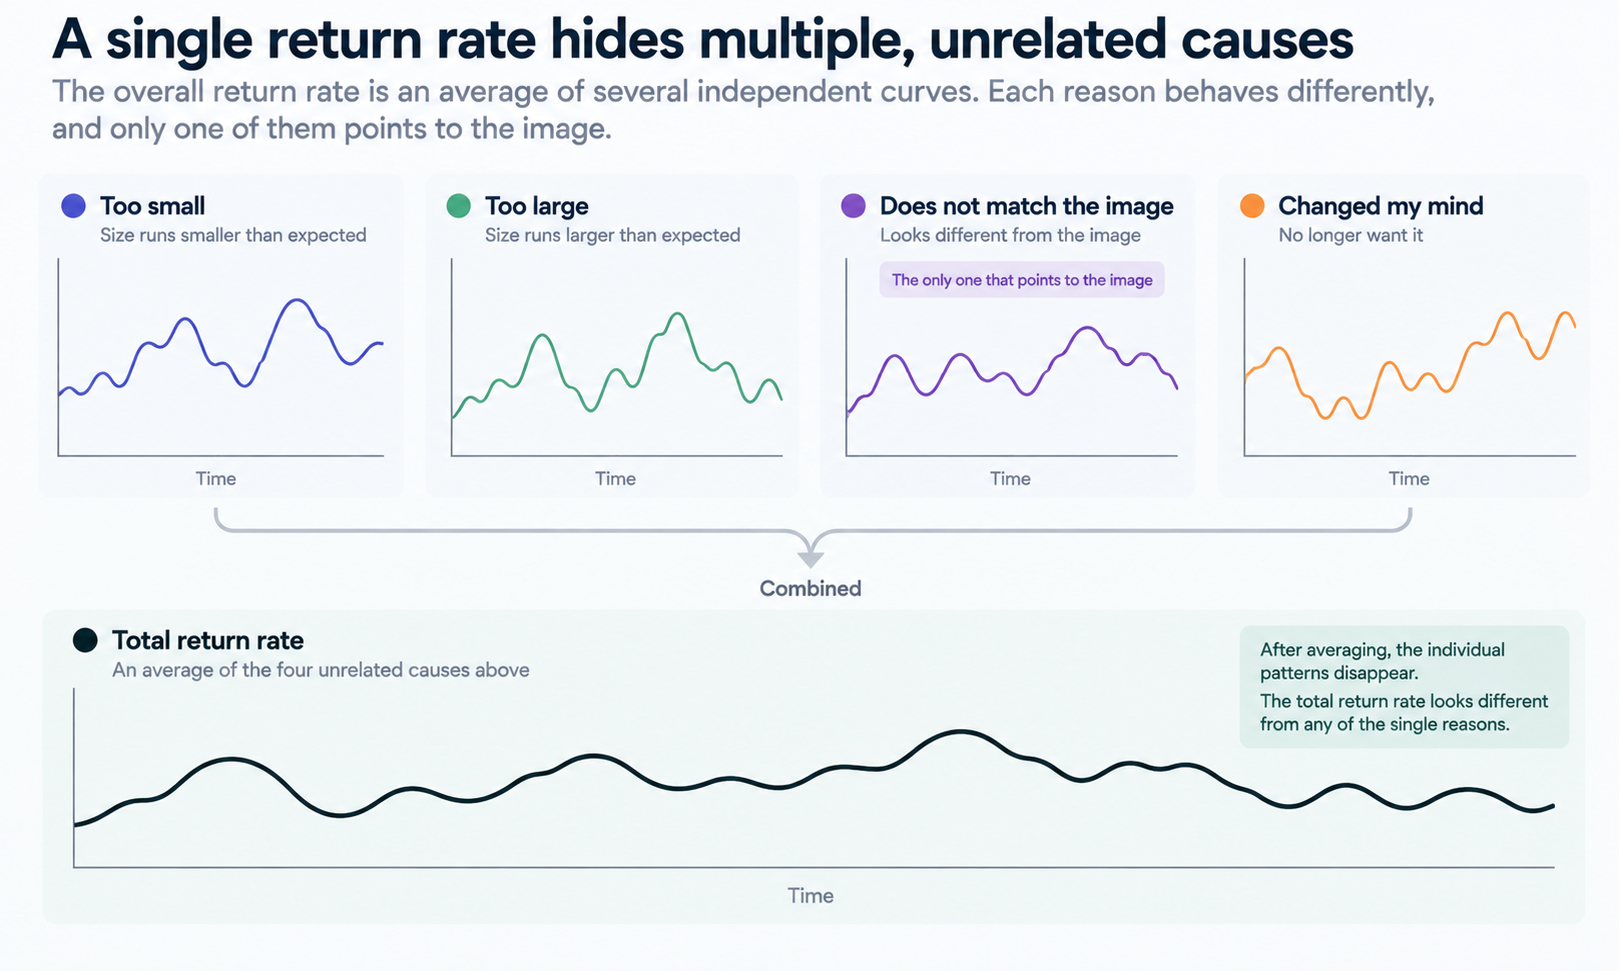
The second question is different and answerable: what your own return data says. Most teams never get there, because the number they look at is a single return rate, and a single return rate is an average over causes that have nothing to do with one another.
Two data questions, only one of them yours to settle
| The question | What the data can say | What to do about it |
|---|---|---|
| Does this technology reduce returns in general | Not settled. Published reviews report conflicting findings and flag limits on combining the studies | Stop quoting percentages in either direction, including favorable ones |
| Did our overall return rate move | That it moved, and almost nothing about why, since the rate averages unrelated causes | Watch it for direction and resist attributing the movement |
| Which reason codes moved | A great deal. Only one of the four points at imagery at all | Separate the codes and read them at style level. This is the work |
| Did our imagery change cause it | Only with a holdout split by traffic, at style level, with the method written first | Run it if you can, and say the cause is not established if you cannot |
The right posture on the first row is to stop quoting figures in either direction, and the right posture on the second is to build the instrumentation, because the second is where a decision actually gets made.
That instrumentation is unglamorous and mostly consists of separating things you are already collecting.
A single return rate is an average over unrelated causes
Returns happen for reasons that move independently. Somebody ordered two sizes intending to keep one. A garment did not fit. A garment fit and was not what the page showed. Somebody changed their mind, or the occasion passed, or a competitor delivered faster.
Averaging those into one figure produces a number that responds to season, promotion, assortment, price, and traffic mix, all of which can move it further than imagery would. Watching it after an imagery change and attributing the movement is not analysis; it is the shape of a conclusion drawn before the data arrived.
The specific loss is that the one cause pointing directly at imagery gets buried. If items are coming back marked not as pictured, that is a signal about your assets, and it can be read without any of the machinery in the next section. If they are coming back marked too small, that is a signal about sizing, grading, and published measurements, and no imagery work touches it. A shade that reads differently on arrival lands in the first code rather than the second, which is why colorway presentation belongs in the imagery conversation rather than the sizing one.
The separation that does the work
Four categories cover most of it, and the value comes from having them separate rather than from having many.
-
Too small and too large, kept apart rather than merged into a sizing bucket, since they point at different ends of the grade and at different fixes
-
Not as pictured, which is the only code that points directly at imagery and the one most worth watching regardless of any test
-
Changed my mind, including occasion and timing reasons, which is a merchandising and demand signal rather than a product one
-
Ordered multiples, where the return was planned at the point of purchase, since including it inflates every other rate and moves with your size guide rather than with your assets
Capture them at the point of return rather than reconstructing them later, and resist adding a fifth and sixth category, because codes that are rarely used get filled in inconsistently and a rarely used code is worse than none.
Then look at the split by style rather than by site. A site aggregate mixes categories that behave differently, and the interesting finding is almost always that one category carries most of a problem attributed to everything.
The most common result is worth naming in advance: the imagery-attributable share is usually smaller than teams assume and the sizing share larger. That is not an argument for ignoring imagery. It is an argument for knowing which of the two you are actually looking at before spending a quarter on either.
What a defensible internal test looks like
If you want to go further than reading the codes, the test has a shape and skipping any part of it produces a result that will not survive being questioned.
Split by traffic rather than by time, so the comparison is not contaminated by season or promotion. Run it at style level, on styles with enough volume for a difference to be distinguishable from noise. Write the method before the test, including what result would count as a null, so the outcome cannot be reinterpreted afterwards. And measure the reason codes rather than the overall rate, since that is where the mechanism would show up if there is one.
The mechanism is worth holding onto while designing this. A return is the gap between what somebody expected and what arrived, and imagery acts on the expectation side only. So an on-model output that represents the garment accurately narrows the gap and one that flatters it widens the gap, which means the direction of any effect depends on your accuracy rather than on the presence of a feature. A test that does not control for accuracy is measuring two things at once.
Most teams cannot run this, and the honest position when you cannot is to say the numbers moved and the cause is not established. That sentence is more defensible than any inference and it protects you in the season the numbers move the other way.
What your data still cannot tell you
Instrumentation extends what you can observe. It does not extend what the asset is.
The output is a visual asset. It does not predict fit, determine sizing, model how a fabric behaves in motion, or forecast returns. Those come from measurements, a graded pattern, a physical sample, and your own data. A well-instrumented return report is that last item working properly, and it still does not make an image into a sizing document.
So a size chart cannot be assembled from imagery however much return data supports the styles it depicts. And no asset can be presented, internally or externally, as the reason a return rate moved, since the rate sits at the end of a chain running through sizing, price, assortment, and traffic. Reason-code evidence narrows which link moved; it does not license a causal claim about an asset.
Color runs through this because a shade dispute becomes a return. Screen color is not a physical reference, exact code matching is not something to promise, and the gap between a monitor and a roll of cloth stays open regardless of display quality. Colorways get settled by strike-offs against an agreed standard, so a colorway shown on a page is a representation rather than a commitment to a shade.
How to report it without overclaiming
Reporting is where careful analysis usually gets undone, and the fix is a sentence structure rather than a policy.
State what changed and what moved in separate sentences, without a connecting word implying causation, unless you ran the test described above. If somebody asks for the link, say what would be required to establish it. That answer is unpopular once and useful every season afterwards, particularly the season the number moves the wrong way and nobody wants to own the earlier claim.
Report the codes rather than the rate, because a rate invites a story and a code split invites a question. And keep the accuracy work separate from the returns discussion entirely: comparing every output against its source is worth doing because it prevents a gap between page and parcel, and that justification does not depend on any returns figure. In Lightchain AI (apparel AI) the uploaded source stays beside every AI Virtual Try-On output derived from it, which is what makes that comparison quick enough to survive a busy week — and across a catalog it is the accuracy rather than the feature that operates on the expectation side.
Whether the imagery runs through Lightchain AI or a camera, the reporting discipline is the same, and it is what keeps a genuine finding from being spent on an overstated one.
Frequently asked questions
Our returns fell after we improved our imagery. Can we claim that?
Check whether the not as pictured code specifically fell while the others held, since that pattern is the closest thing to evidence available without a holdout. If everything fell together, something broader changed and imagery was one of several candidates. Say what changed and what moved, in separate sentences.
How many reason codes should we have?
Four, used consistently, which beats eight used sometimes. Rarely used codes get filled in inconsistently and a code nobody trusts contaminates the ones that work. Add a fifth only when a real decision depends on separating something the four already cover.
We do not control the returns flow. What then?
Work with whatever the platform or the retailer provides, and note which categories it merges, since knowing the merge is most of the interpretation. Where only a single rate is available, watch it for direction and resist attributing movement. An unattributed observation is more useful than a confident wrong one.
Is the imagery share really usually smaller?
That is the common pattern rather than a rule, and your own split is the only version that matters. Teams are frequently surprised in both directions, which is the argument for looking rather than for assuming either answer. The point of separating the codes is to stop guessing.
Should we still improve imagery if the share is small?
Yes, for a reason that does not depend on returns: an image that does not match the parcel damages trust regardless of whether the item comes back. Accuracy is worth doing on its own terms. Basing the case on a returns figure means the case collapses the first time somebody asks for the source.
What about styles with too little volume to test?
Read the codes rather than running a test, since reason-code evidence needs far less volume than a split test does. Group low-volume styles by category for the read. A test on a style with insufficient volume produces a number with a confidence interval nobody will quote.
In closing
The general question about this technology and returns is unsettled in the published literature, and quoting a percentage in either direction is not available. Your own question is answerable, and the answer lives in a reason-code split most teams do not have. Separate too small from too large, keep not as pictured on its own, exclude planned multiples, and read it at style level. That tells you which link in the chain moved. It does not license a causal claim about an asset, and the accuracy work is worth doing whether or not the number cooperates.
Start here
Pull one season of returns and split them four ways. If your system merges categories, note which ones, since the merge is part of the answer. Most teams find the imagery-attributable share smaller than assumed and the sizing share larger, and either result changes where the next quarter of effort should go. The exercise costs an afternoon and replaces an argument that otherwise recurs every season.
**Start with catalog-scale asset work → **https://www.lightchainai.com/global/solutions/scaleECommerce